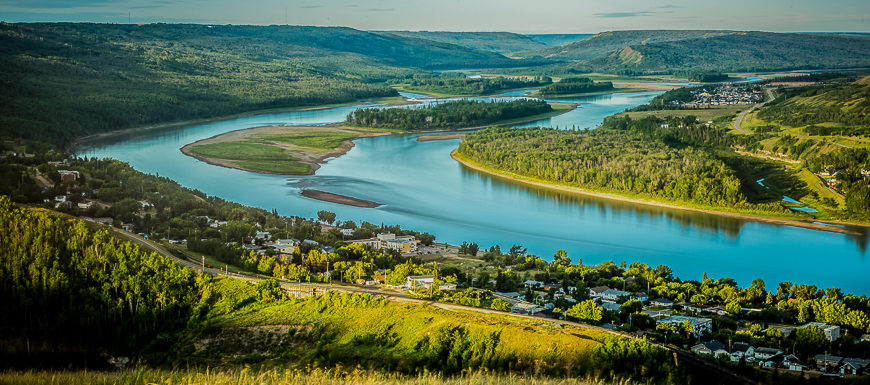
Community Profile
In late 2016, Peace River had the opportunity to have a retail trade area profile completed through the Peace Region Economic Development Alliance (PREDA), with data prepared by Cushing Terrell Architecture Inc. This data provides a snapshot of Peace River and the surrounding area, as well as the the demographic and labour trends at play towards the end of 2016. Additionally information from Statistics Canada has been used.
Demographics
Population Growth over time
While Peace River has experienced ebbs and flows of population due to resource boom bust cycles, our long term trend is steady stable growth. In the graph below data from 1986 to 2018 comes from StatsCan.
Age
Peace River has an ideal population distribution with a bottom heavy pyramid, this model is consistent in our neighbouring municipalities as well. Below you can see the spread for both Peace River and the trade area within a 15 minute drive of the town.
Education
Education credentials attained in Peace River reflect our town’s history as both an administrative hub for the region as well as centre for resource extraction. Additionally the town is growing hub for education and training in the north. Northern Lakes College operates a campus in Peace River, and the Northern Alberta Institute of Technology opened a boreal research facility in 2014. Three school divisions also base operations out of Peace River including Peace River School Division No. 10, Holy Family Regional Catholic School Division and Northlands School Division.
Economy
The largest employers in Peace River are the resource extraction industry, Government of Alberta and DMI. DMI operates a pulp mill outside of town while a number of government ministries have their services centred here. As a result of the stable employment offered in those two sectors Peace River attracts financial and management professionals as well as sales and services businesses. In addition to bitchumen and forest products Peace River is surrounded by an active agriculture and ranching economy, which further bolsters the retail opportunities.
Labour Force and Occupations
Household Income
Residents enjoy a fairly high standard of living in Peace River, made evident through household income statistics. The mode of the data is in the $100k to $150k bracket while the median household income is $93,778. The chart below shows each income bracket and how many households in town earn a gross household income in that bracket.
| Under 20k | 211 |
| 20-40k | 272 |
| 40-60k | 397 |
| 60-80k | 319 |
| 80-100k | 315 |
| 100-125k | 385 |
| 125-150k | 347 |
| 150-175k | 231 |
| 175-200k | 142 |
| 200-250k | 91 |
| 250k Plus | 122 |
Retail Spending Per Household
Whether it’s Japanese, Chinese, Italian, Steakhouse, fast food, Middle Eastern or something else, Peace River and our residents love our restaurants food and dining out. The chart below show the average breakdown of household spending in Peace River.
| Full & Quick Service Resturants | $9,605 |
| Grocery & Speciality Foods | $8,158 |
| Auto, RV, Motorsports Dealership | $6,126 |
| Home & Personal Electronics & Appliances | $3,103 |
| Clothing & Apparel | $2,510 |
| Alcohol & Tobacco | $2,155 |
| Home Furnishings & Accessories | $1,756 |
| Personal Services | $1,613 |
| Entertainment & Leisure | $1,385 |
| Pharmacy | $1,062 |
| Speciality Retail | $1,053 |
| Home Improvement & Gardening | $921 |
| Footwear | $769 |
| Health & Beauty | $751 |
| Books & Multimedia | $528 |
| Sporting Goods & Recreation | $399 |
| Toys & Hobbies | $387 |
| Jewelry & Accessories | $369 |
| Auto Parts & Accessories | $232 |